Every snore has a fingerprint
Not a volume. Not a count. A shape — a distinct pattern of frequencies that a microphone under the mattress can pick apart, night after night, into something far more informative than "loud" or "quiet."

Your ear doesn't measure sound in hertz
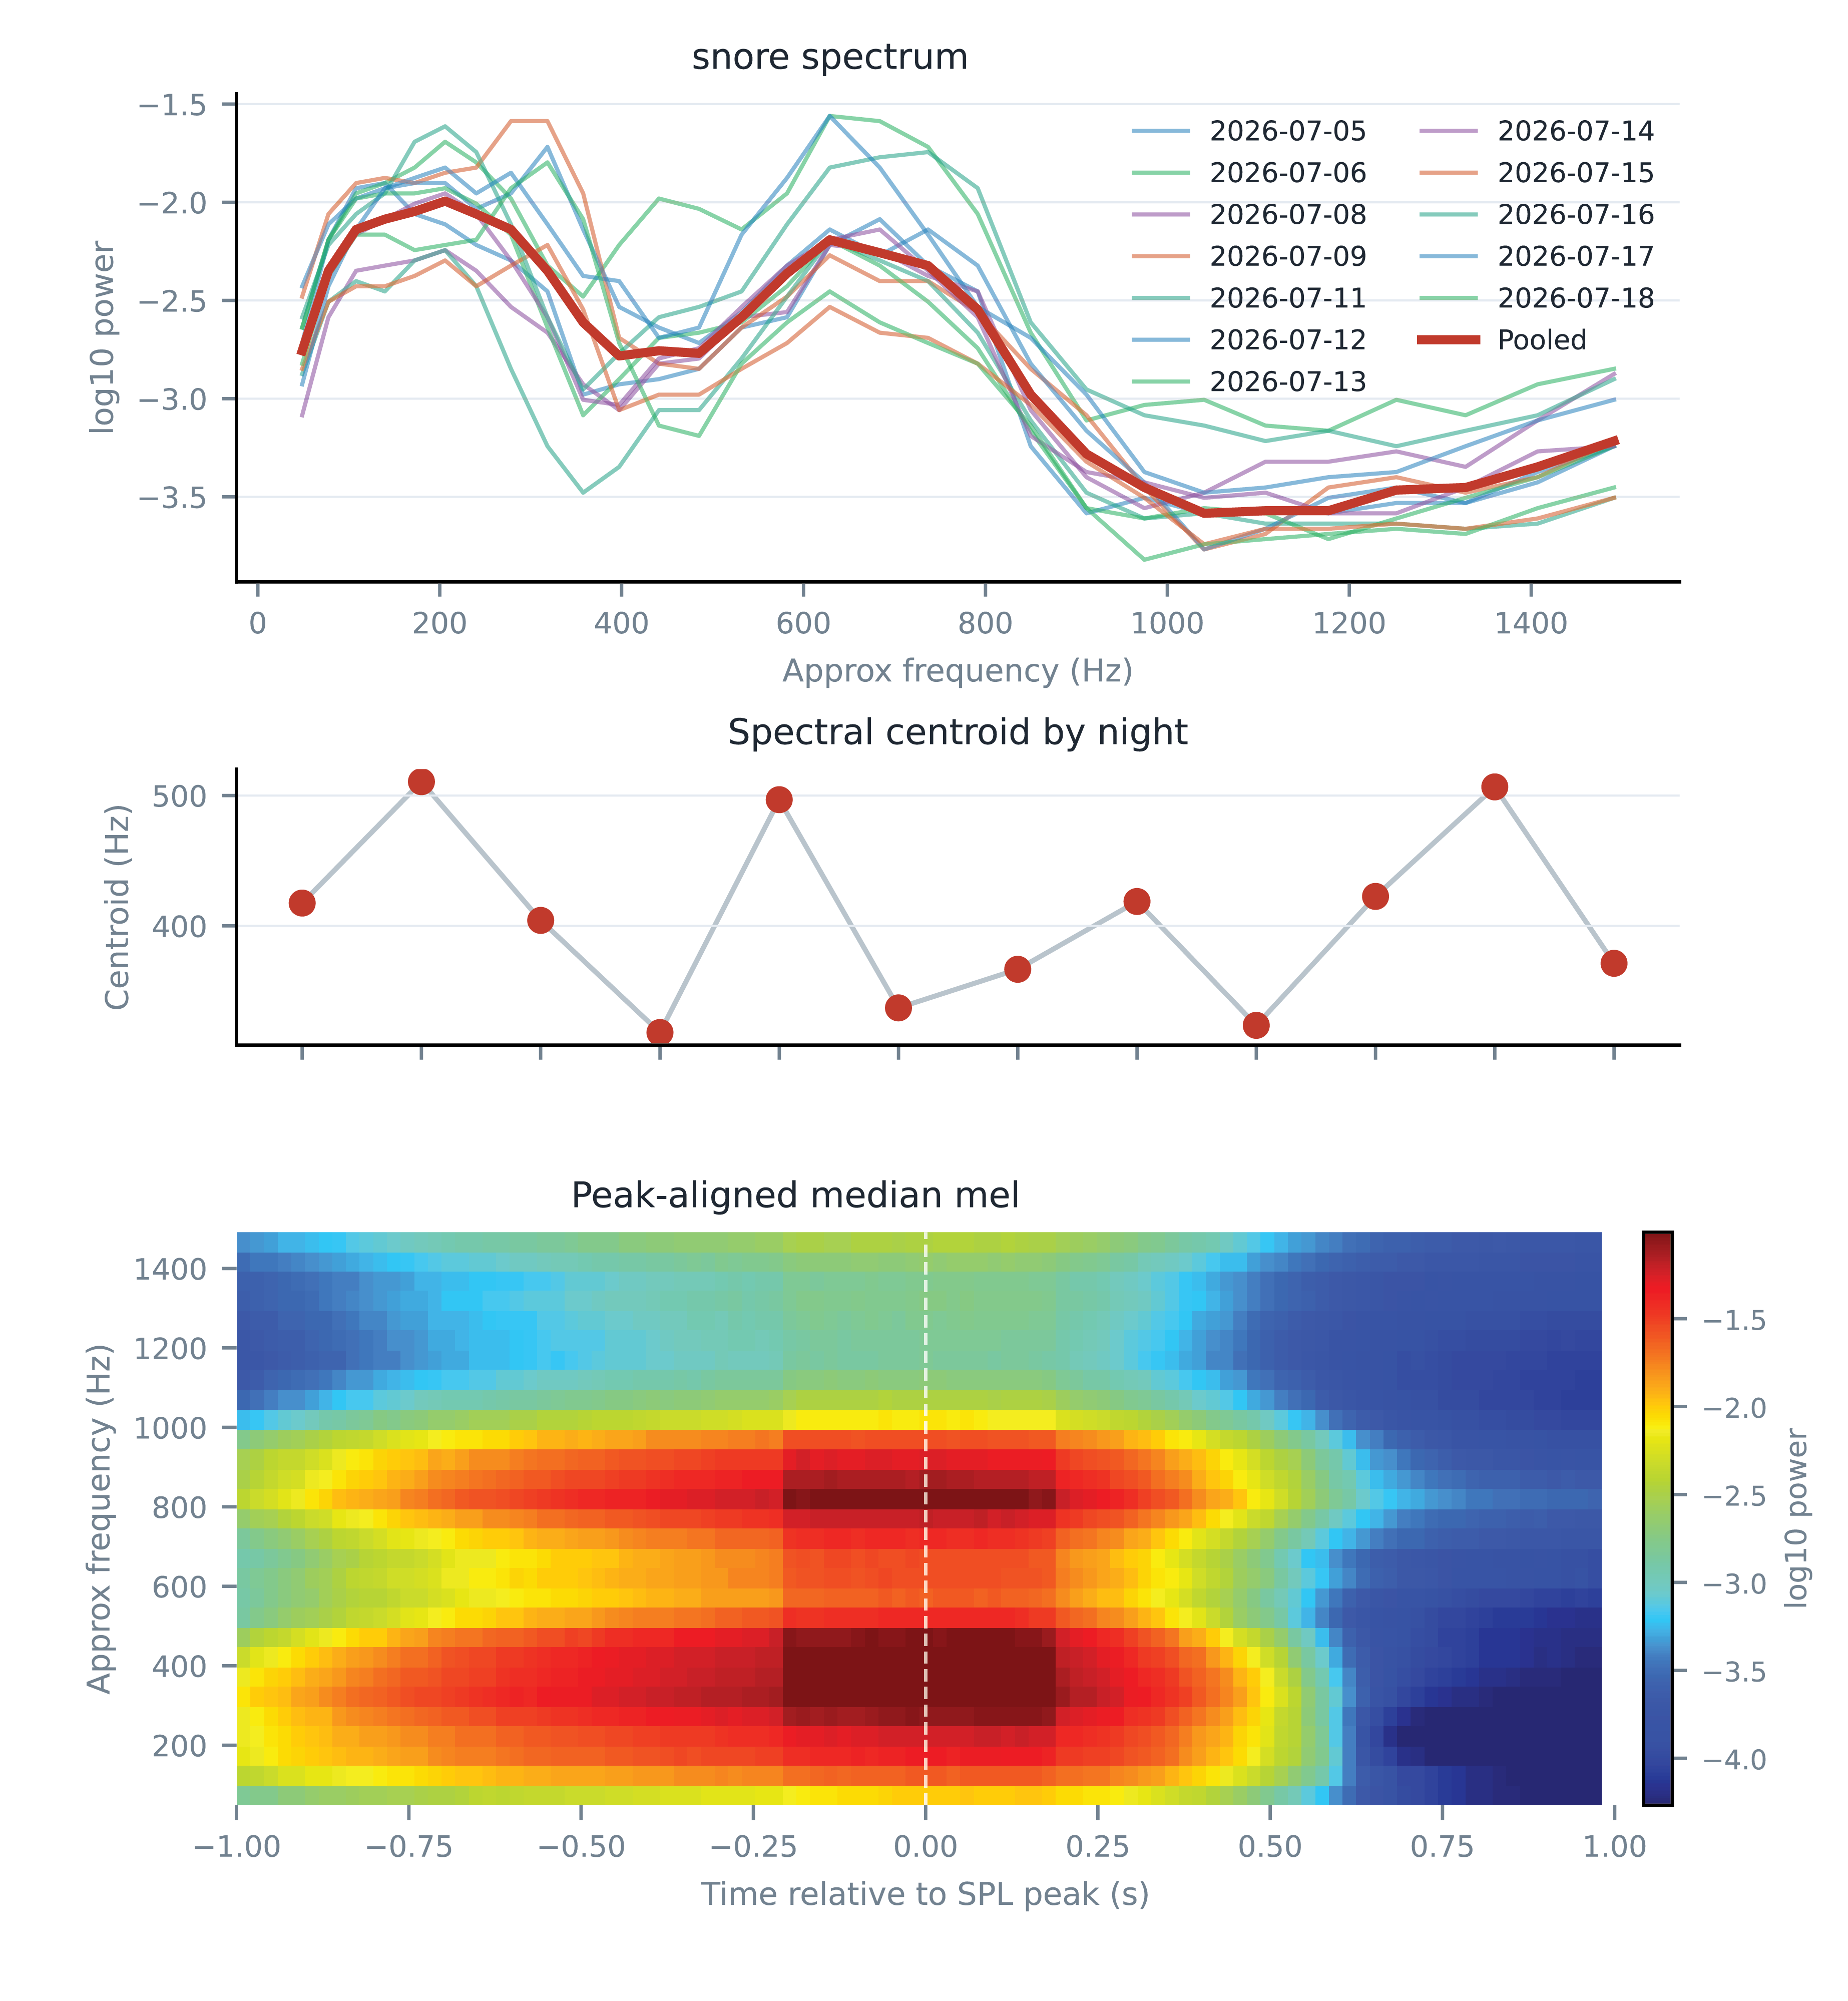
Ask most sleep trackers what happened last night and they'll give you one number: how loud, how often. But a decibel meter is a blunt instrument — two completely different sounds can hit the exact same peak volume. What actually distinguishes them is shape: which frequencies are loud, which are quiet, and how that pattern evolves over a fraction of a second. That shape is the acoustic equivalent of a fingerprint.
To capture it, MEDBUG doesn't just log a volume — it builds a mel spectrogram: a map of energy across frequency and time. The "mel" part matters. It's not a linear ruler of pitch; it's built to match how your own cochlea actually hears.
Snoring, breathing and airway noise all live mostly in that crowded, low-frequency region where human hearing — and the mel scale — pays the most attention. Building the model's input around that scale isn't a stylistic choice; it's aligning the sensor with the part of the spectrum that actually carries the signal.
Most tools only listen for one sound
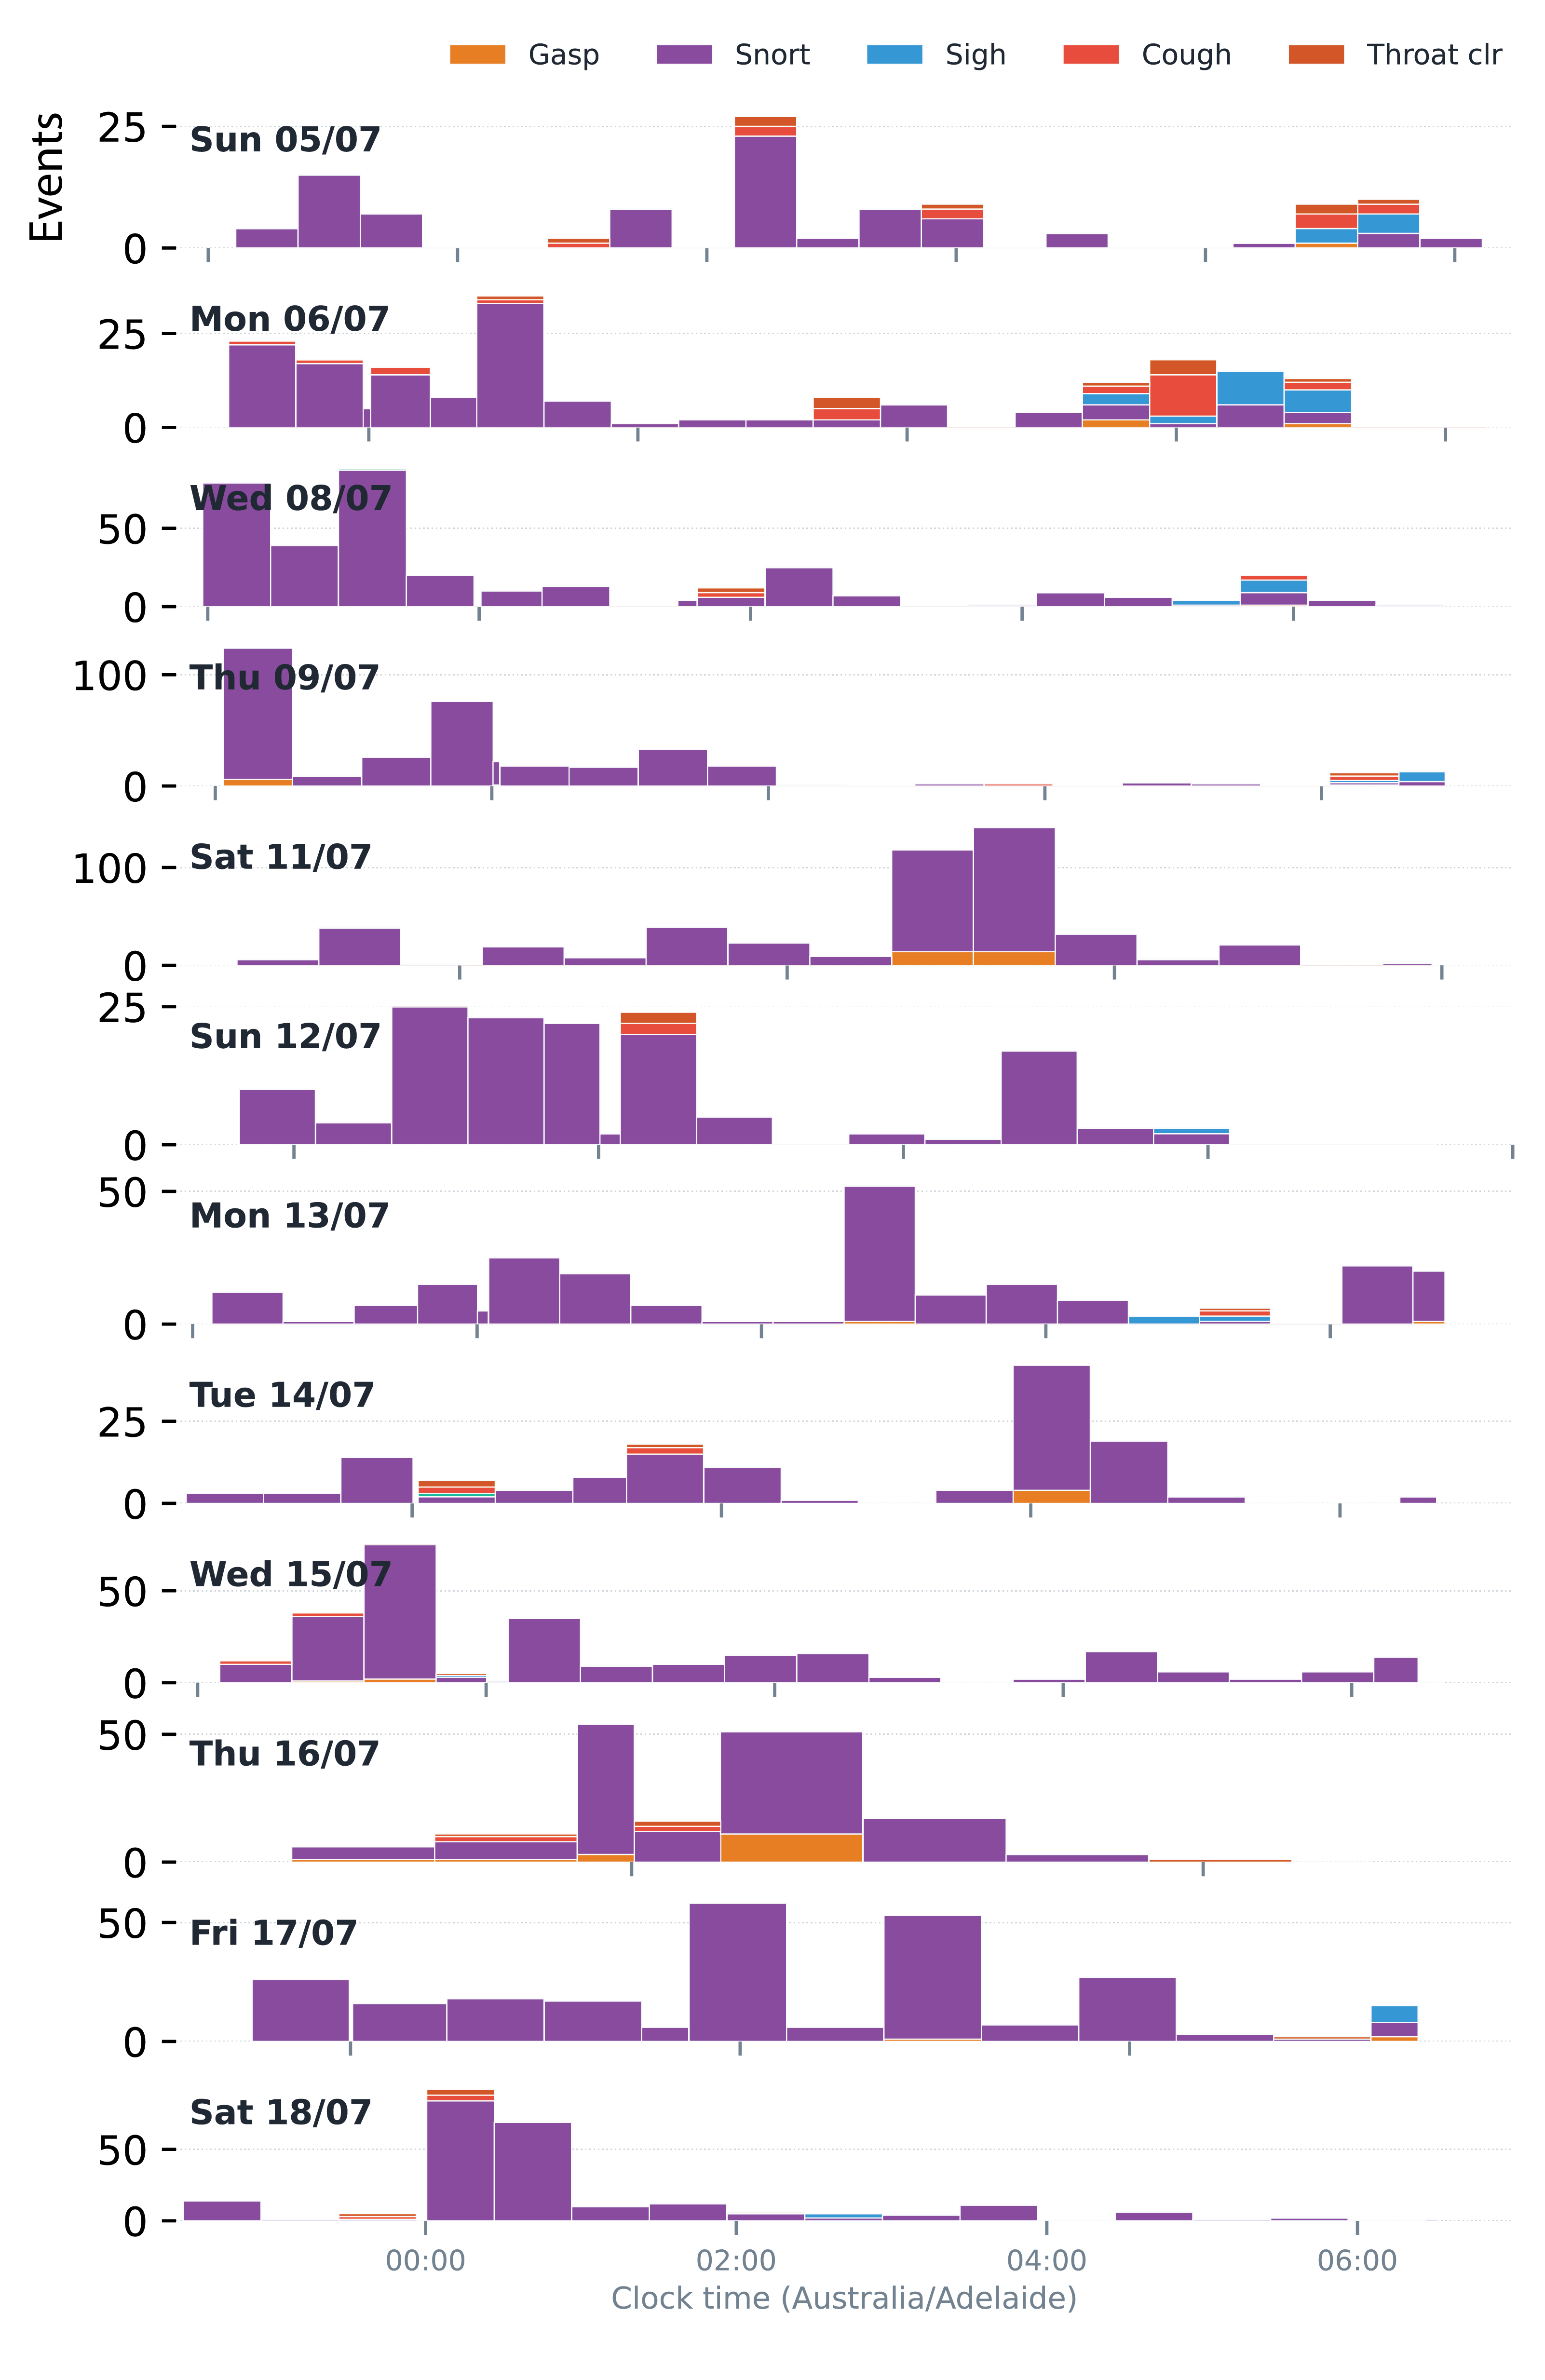
Ask a typical snore-tracking app what it heard, and "snore" is usually the only answer on offer — anything that doesn't fit gets ignored or lumped in as noise. That's a problem, because a night of disordered breathing is loud in more ways than one: gasps as the airway reopens, sighs from the nervous system resetting, coughs, throat-clearing — each with its own acoustic shape, each potentially telling a different part of the story.
Because these events are subtle and time-consuming to hand-score, most research has historically had to ignore them at scale — there simply hasn't been a practical way to label thousands of hours of audio. MEDBUG's classifier changes that arithmetic: it distinguishes over 10 distinct acoustic subtypes automatically, every night, with no one listening in.
Where in the night — and which night — is the real story
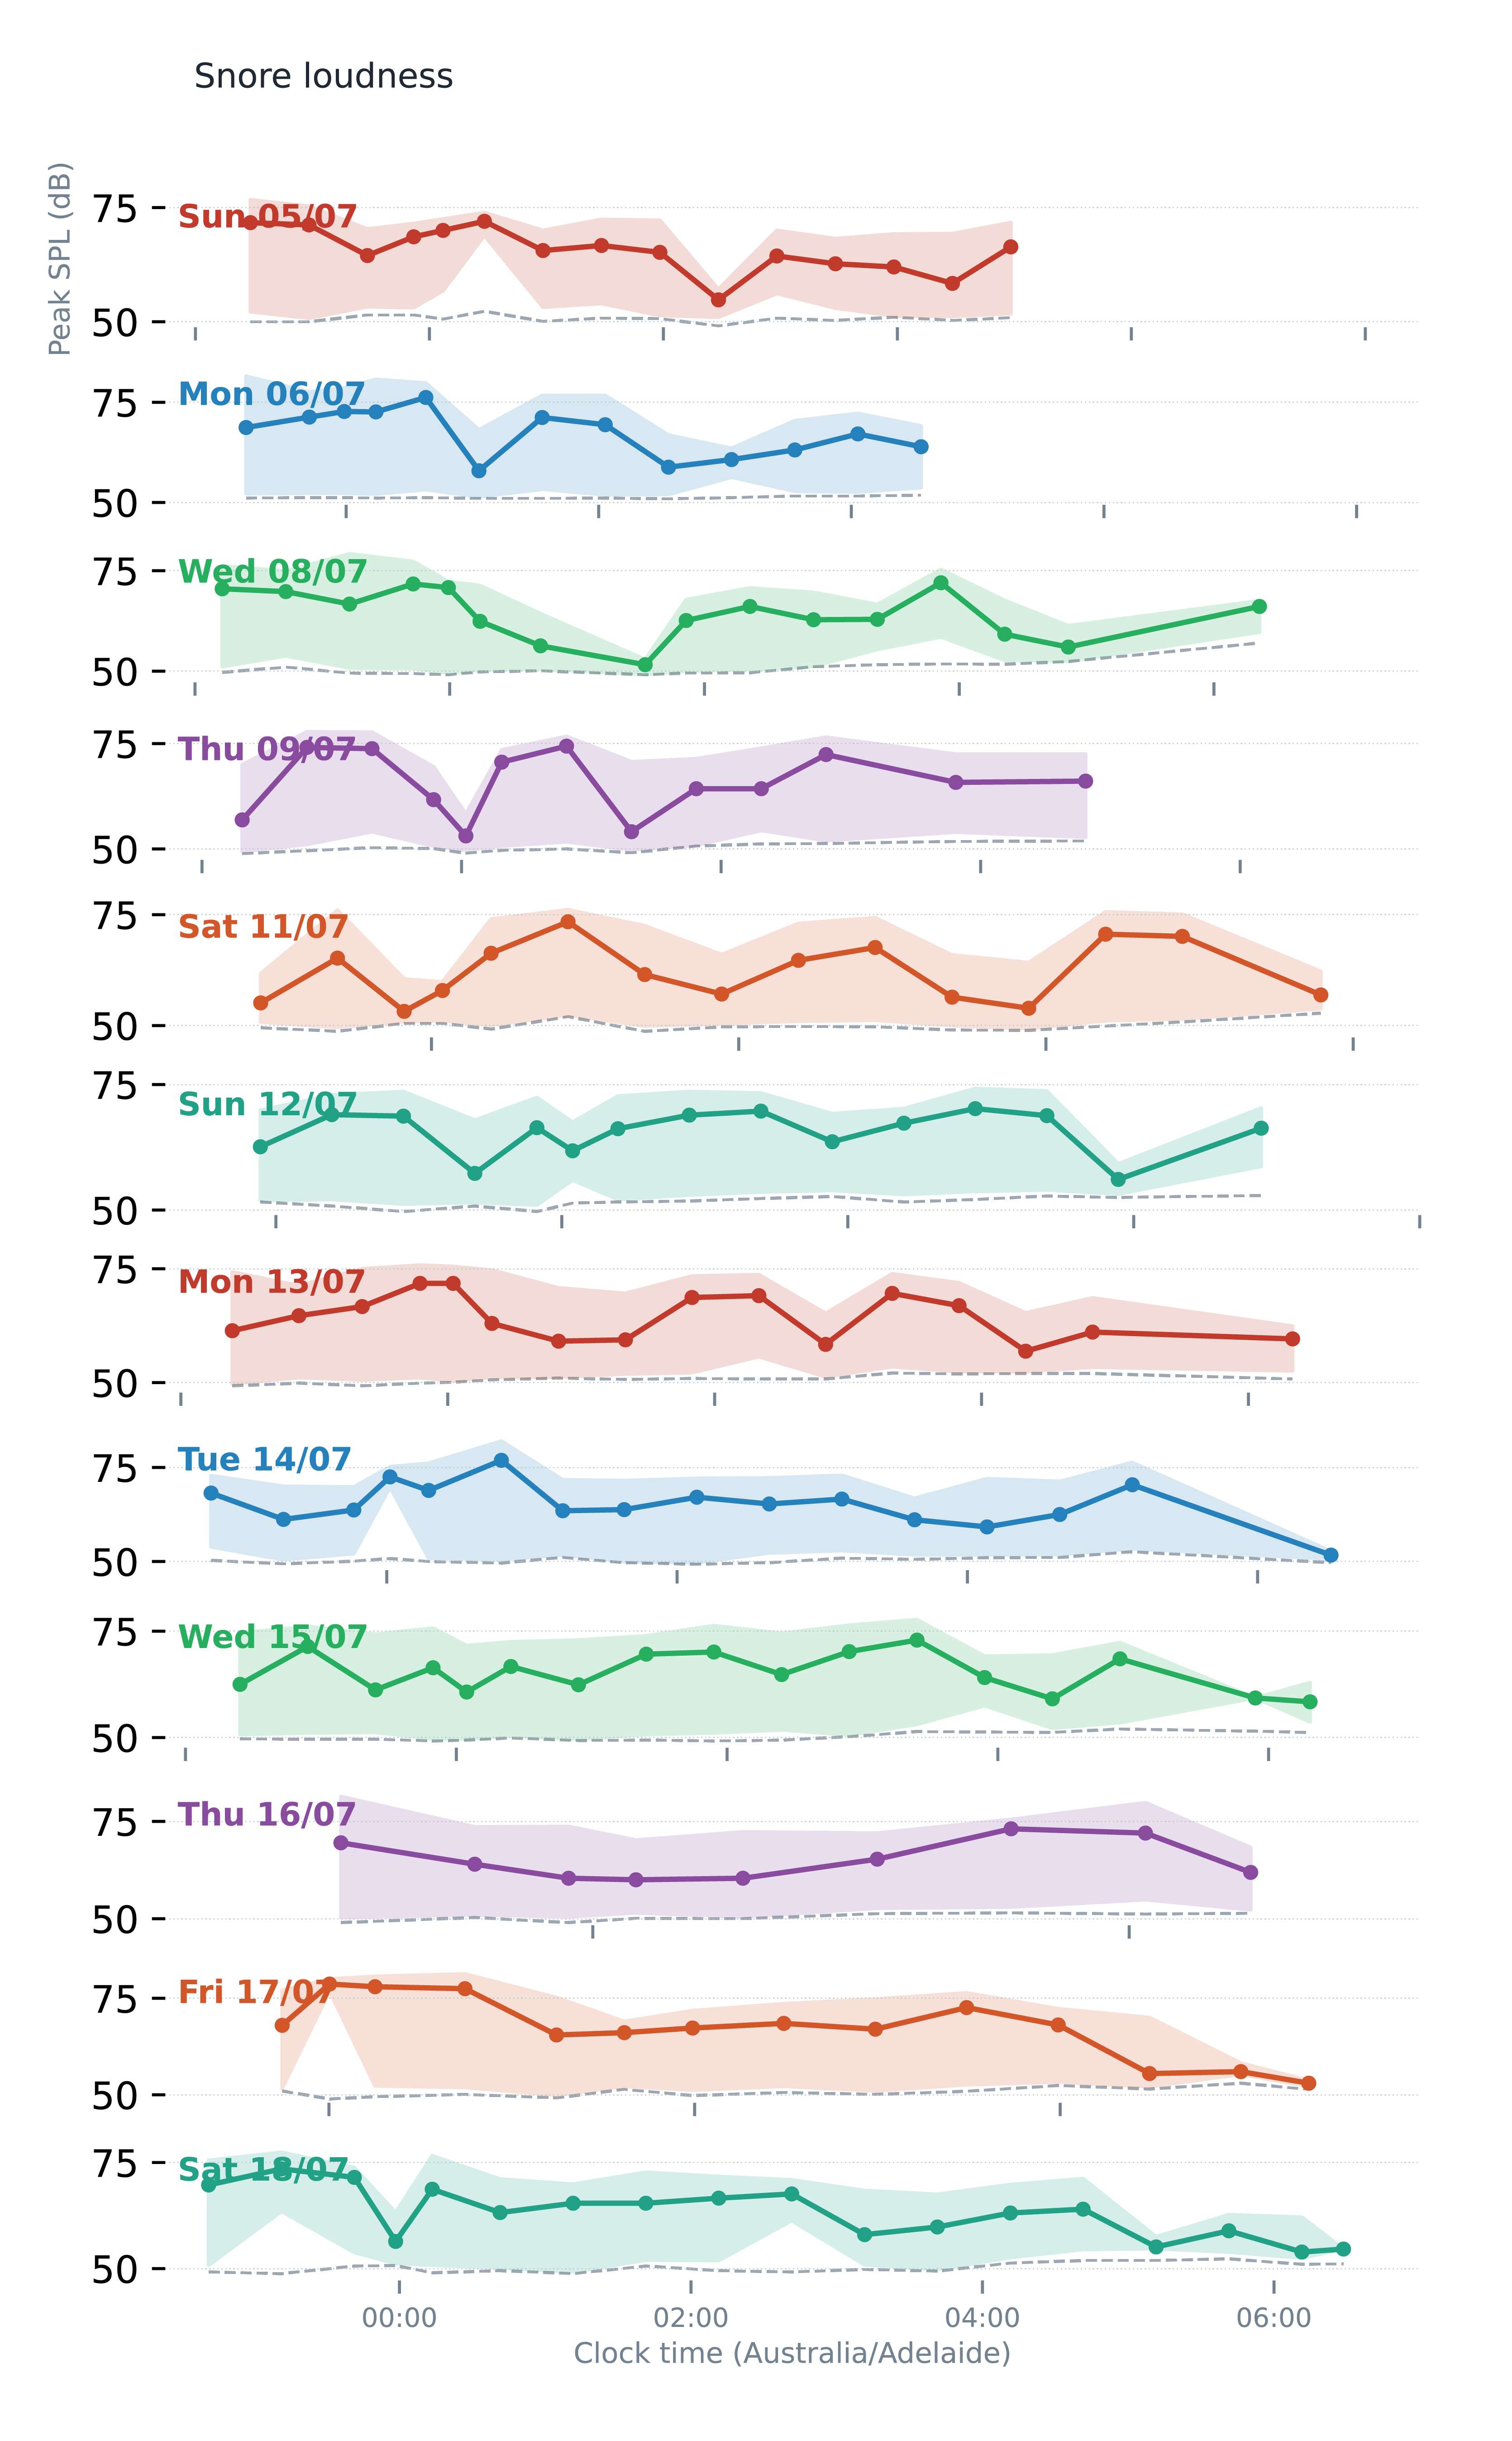
Even with the right acoustic fingerprint, a single "average loudness" per night still hides more than it reveals. Snoring isn't a steady drone — it swells and fades within an episode, and whole nights differ from each other depending on position, alcohol, congestion, or nothing identifiable at all. A meaningful picture needs both axes: within a night, and across many of them.
1Within one night
Loudness rises and falls episode to episode — a rough patch at 1 a.m. doesn't mean the whole night was rough, and a calm start doesn't guarantee a calm finish.
2Across many nights
The same person can look completely different from one night to the next — which is exactly why a single lab study was never going to be the full picture.
Stretched across 12 consecutive nights, this becomes less like a single test result and more like a rhythm — clusters of rough patches, quieter stretches, occasional one-off outliers. That's information a single lab study, by design, can never capture: it's built to summarize a night, not to reveal how one night differs from the next.
A summary score tells you something happened. A timeline tells you when, how often, and whether it's getting worse. — On the value of continuous acoustic monitoring
Three things worth remembering
A fingerprint, not a volume knob
The mel spectrogram captures the shape of a sound the way your own ear hears it — and that shape carries far more information than peak dB ever could.
Snoring is only one of the sounds
Gasps, sighs, coughs and more all have distinct signatures — a model that can tell them apart, at scale, sees more than "snore / not snore."
One number was never the goal
A full night — and a full run of nights — reveals timing and variability that a single summary statistic quietly throws away.
Technical note
MEDBUG records the microphone at 16 kHz, then turns the waveform into a mel spectrogram on the device. The raw recording can stay at the bedside — only that compact frequency map needs to leave — so privacy is protected without throwing away the acoustic fingerprint. The map can then be processed in the cloud or on a local machine to tell pathology-related sound subtypes apart (snore, gasp, cough, and more) and how they line up with overnight physiology.
None of this replaces a clinical diagnosis on its own — but it does something a stethoscope-era view of "snoring" never could: it turns an ordinary, ignored bedroom sound into a continuous, structured signal. That's the quiet premise behind acoustic sensing — the noise was never just noise.
Quick answers
Is this just measuring how loud snoring is?
No. The useful signal is the frequency shape of each sound — a mel spectrogram — not a single volume number. Two sounds can share the same peak dB and still look completely different.
What sounds can this pick apart?
Beyond snoring, the approach looks for distinct acoustic fingerprints such as gasps, sighs, coughs and other overnight events — so the night is richer than a snore / not-snore label.
Is this a clinical product yet?
This page is an illustrative research summary from home recordings. It supports further acoustic phenotyping work; it is not a cleared medical device claim for diagnosis or treatment decisions.