Can one mattress signal
show how hard you're breathing?
A single mattress trace carries both how much air moves and how hard the body works to move it. A Transformer model — checked night after night against an oesophageal catheter and calibrated airflow mask — learns to pull the two apart, from a bed that's never touched.

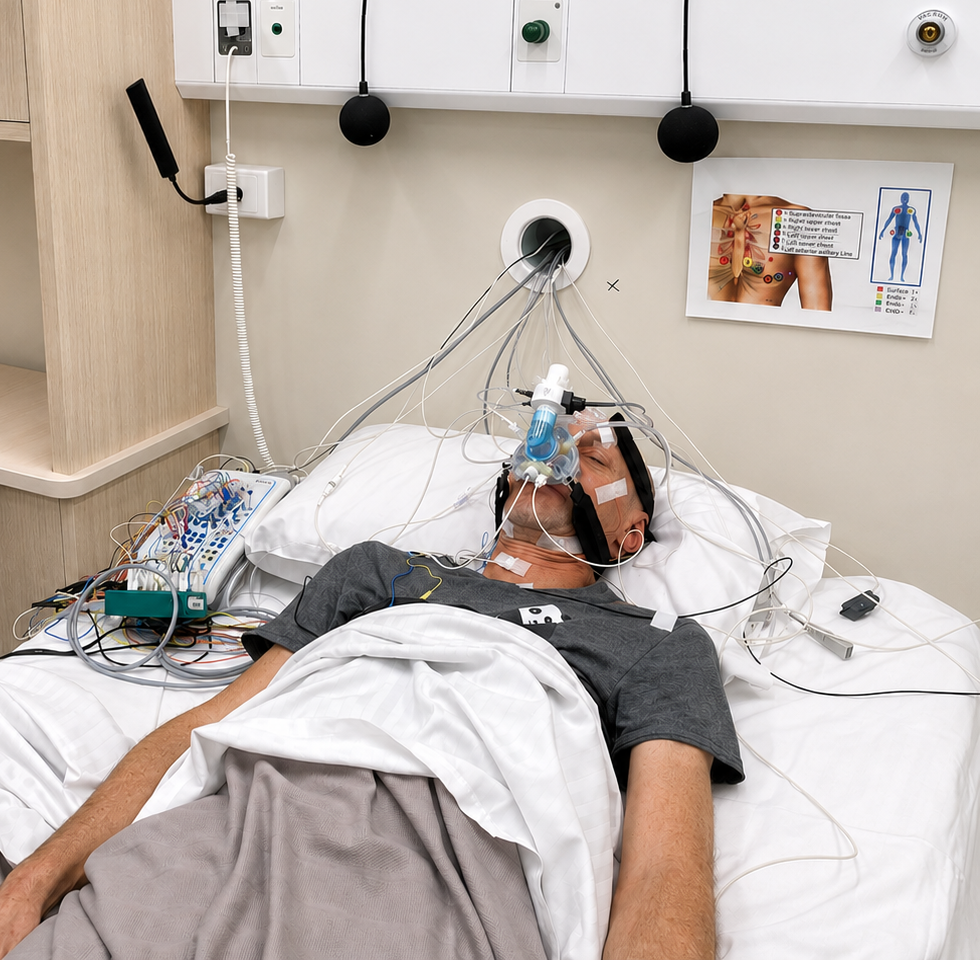
One mattress trace, two signals — how much air moves (ventilation) and how hard the drive to breathe is pushing (effort), pulled apart without a catheter or mask at home.
Why bother separating them?
the case for going beyond AHI
The apnoea-hypopnoea index counts events, but it can't say why someone's airway keeps collapsing. That answer lives in the relationship between ventilation (how much air actually moves) and respiratory effort (how hard the drive to breathe is pushing). Track both continuously and you can start to read out a patient's own physiology: how collapsible their airway is, how aggressively their control system over-corrects (loop gain), and how little strain it takes before they wake up (arousal threshold).
Measuring this properly has always meant an oesophageal balloon catheter and a sealed pneumotachograph mask — accurate, but invasive enough that it's confined to single research nights. This study asks whether a mattress sensor, trained against that gold standard, can carry the same information home.
Where the model tracks best
night-level correlation with gold-standard signals
Performance is naturally weakest at wake — restless, non-respiratory movement swamps the signal, exactly as it would for any motion-based sensor. Every asleep state the model was built to watch tracks moderately-to-strongly.
Home feasibility
n=13, 131 nights total
| Setup autonomy (no help needed) | 100% |
| Hardware logging success | 100% |
| Signal usability | 94.6% |
| Nights per participant | 10.1 ± 3.8 |
| Utilization efficiency | 62.7 ± 24.5% |
Against other volume sensors
| Method | Setting | Perf. |
|---|---|---|
| Ambulatory RIP (LifeShirt) | Exercise | R=0.91 |
| Calibrated RIP software | Sleep/OSA | 13–42% MAE |
| Microwave Doppler radar | Overnight PSG | 11% MAE |
| This study — mattress + Transformer | Natural sleep | 15.6% MAE |
Two patients, same AHI
what home monitoring reveals that one lab night can't
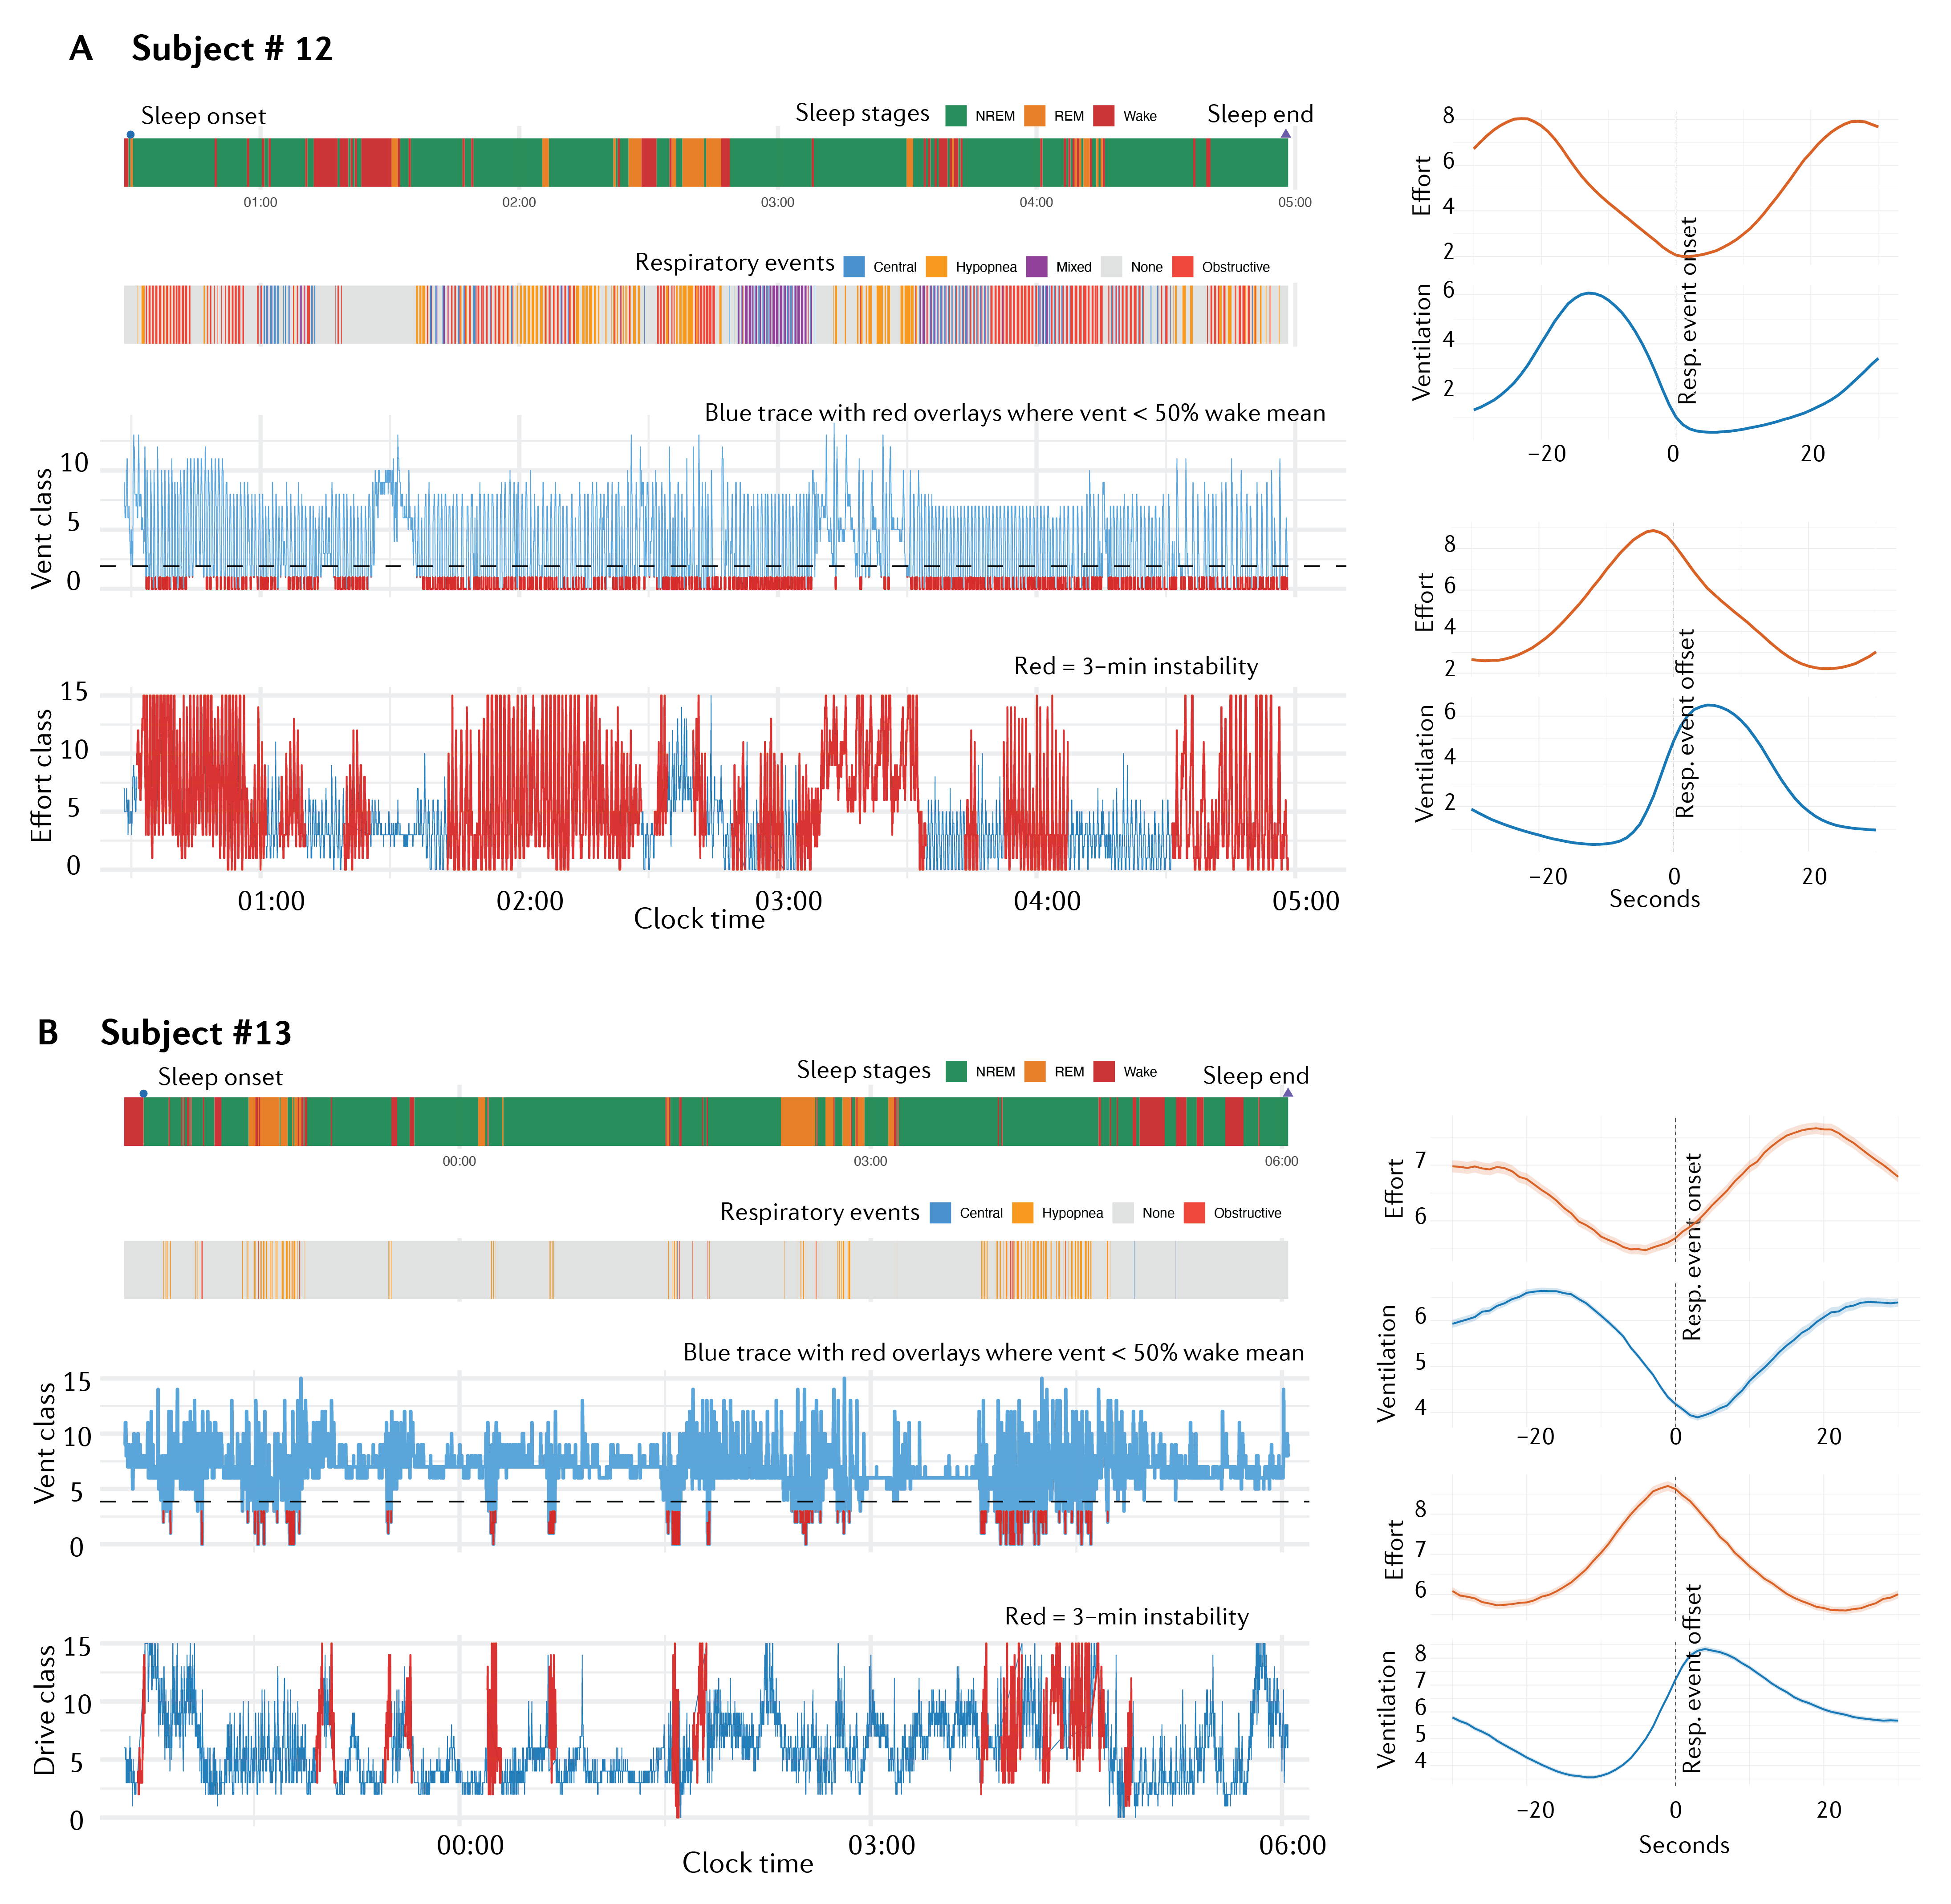
Two patients, same lab AHI — overnight home profiles and event-triggered averages. One night looks unstable and high-burden; the other looks calm. A single AHI number would have called them the same.
Subject #12 unstable
Ventilation burden over 50% of the night; ~60% of sleep flagged as effort-unstable. Clear crescendo effort building to airway reopening, then a sharp hyperventilation overshoot.
Subject #13 stable
Same in-lab AHI as #12 — but home data shows burden and instability both under 10% of sleep time. Milder hypopnoeas, minimal post-event overshoot: lower loop gain.
Two patients who look identical by AHI alone turn out to have very different underlying physiology once you watch them for more than one night.
Why it matters
Ventilatory burden can out-predict AHI for some cardiovascular outcomes in published research. Tracking ventilation night after night in research settings makes that physiology available for multi-night investigation.
Known limits
Only 13 participants; outputs are scaled per-person on a 0–15 scale rather than absolute physical units (L/min, cmH₂O) — a calibration step still to come.
What's next
Larger external cohorts, absolute-unit calibration, and linking home-measured burden to real cardiovascular and cognitive outcomes over time.
Quick answers
How is this different from AHI?
AHI counts how often breathing is disturbed. This work tracks continuous ventilation and effort — the pattern behind those events — so two people with the same AHI can look very different night after night.
What was the gold standard?
A lab night with a calibrated airflow mask and an oesophageal balloon catheter, then unsupervised home monitoring with the mattress sensor alone.
Is this a clinical product yet?
These results are research validation in a small cohort. They support further phenotyping work; they are not a cleared medical device claim for diagnosis or treatment decisions.
Full manuscript: not yet publicly available. This page is a research summary only.
Peer-reviewed link forthcoming